
Analyses
From detected and classified cells to region-free maps and your own Python analysis.
Exploit the power of exploratory analysis
Most analyses start by picking regions of interest, which means you only find effects where you already expected them. Region-free statistics plot every classified cell, or its density, in atlas space, so unexpected hotspots and group differences show up first.
- Detect every nucleus, then classify each marker, here NeuN and Olig2
- Map the cells into atlas space and view them as cells or density
- Compare groups side by side, then build region-level statistics around what you found
Rat coronal section · AP -3.12 mm · 304,518 nuclei
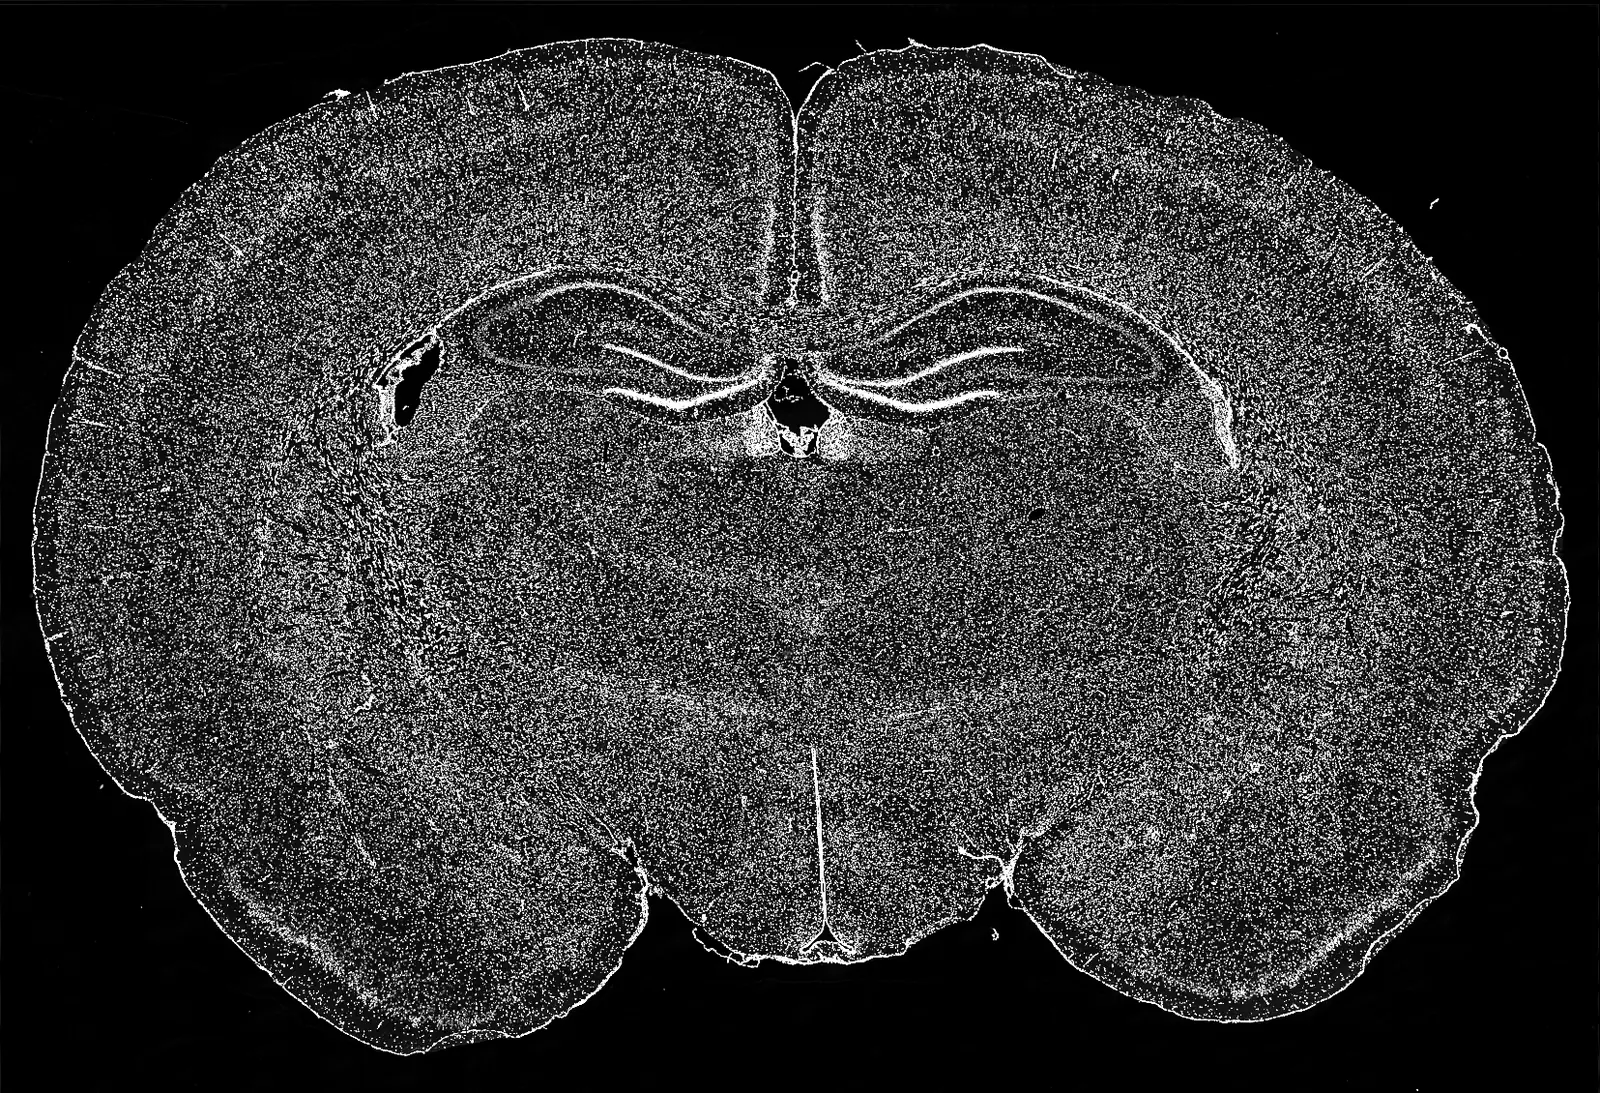
Source image: Maric et al. (2021), Figshare, CC BY 4.0. Adapted with NeuroQP analysis overlays.
Works with the images you already have
You don't need to re-image or add stains to fit the tool.
- No DAPI? Detect cells directly from cFos or TRAP markers
- Full-brain 10x or 20x slices, with no separate 4x reference
- Or 4x overview + 10x/20x detail fields
- Pretrained cFos/TRAP classifiers, or train your own
Your data stays yours
Export a whole project as one reproducible archive, or load it in Python and continue your own analysis.
pip install neuroqp- Images, registrations, masks, training samples and full classification results in one export
- Cells and classifications as NumPy arrays
- Plots exported as editable SVG
Bring the images you already have.
Upload, review, and export region-level results without plugins, scripts, or a GPU.